
Bright days
In 88,905 UK adults who wore a light sensor for a week, the brightest nights went with a higher risk of dying over eight years, and the brightest days with a lower risk. It is a link: other differences between people may explain part of it.
Did brighter nights and darker days go with earlier deaths?
Yes, as a link: the brightest nights went with a higher risk of dying over eight years, the brightest days with a lower risk.
Researchers in Australia, the US and the UK used the UK Biobank, a large British health study. Between 2013 and 2016, 88,905 of its volunteers, aged 62 on average, wore a light sensor on the wrist for a week.1
From each week, the team defined night light, what the sensor saw from 00:30 to 06:00, and day light, from 07:30 to 20:30. They ranked everyone against everyone else, then followed them for about eight years. In that time 3,750 died.1
In the study's most adjusted model, the brightest tenth of nights went with about 21% higher risk of dying, compared with the darker half. The brightest tenth of days went with about 17% lower risk. These are shares of risk, not 21 extra deaths in every 100 people.1
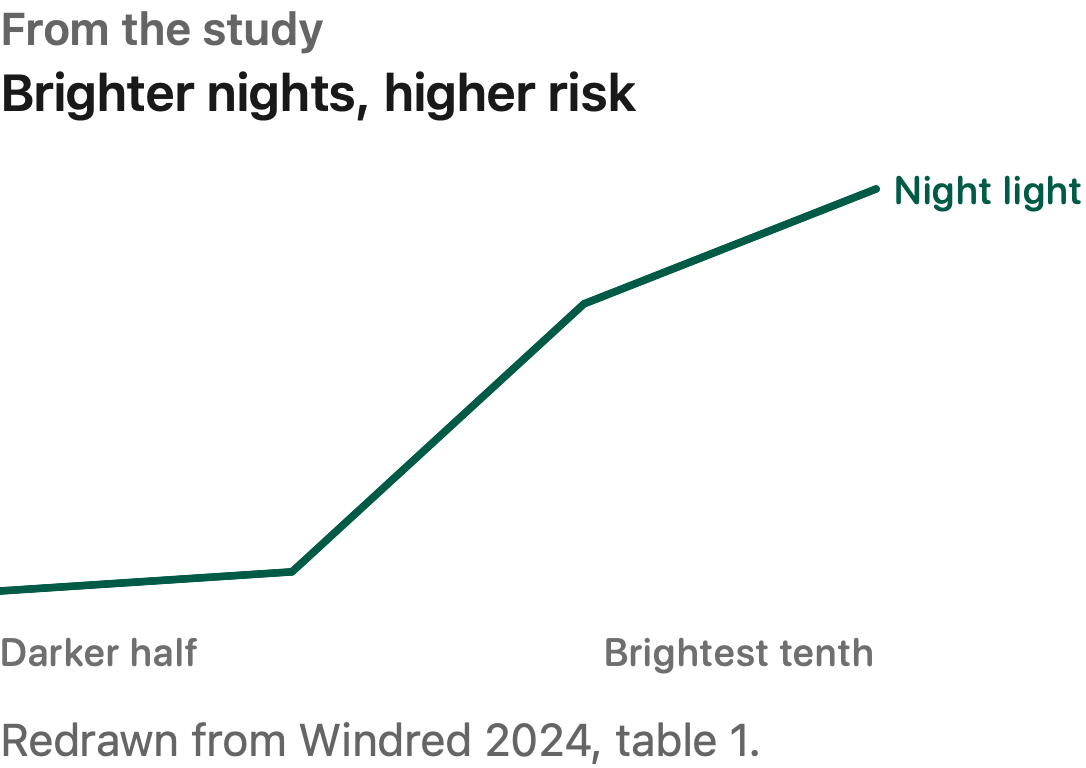
Night light stepped up late. The next group above the darker half showed no clear difference, and the one after it about 15% higher risk. Day light stepped down at every group, starting at about 10% lower risk.1
Night light is what the sensor saw in the small hours, when you are likely in bed. Evening lamps are a separate question, taken up in the Lamplight article.1
Could other differences between people explain it?
Partly. The gaps shrank once the team allowed for more factors, and short sleep weakened the night link, but the day link held.
The team ran three models. The first allowed for age, sex, ethnicity and the length of daylight in the season. The second added work, education, income and area deprivation. The last added physical activity, smoking, alcohol, where people live and social activity.1
Each step shrank the gaps. In the first model, both were about a third.1
Counts show why the comparison needs the models. During follow-up, about 4% of people with the darker nights died, against about 5% in the brightest tenth. By day the raw shares were about the same in both groups: the lower risk appears only in the adjusted comparison.1
Sleep was an extra check. Adding short sleep, under 6 hours a night as the sensor judged it, weakened the night link: the brightest tenth went from 21% to 11% higher, and that could be chance. The day link did not weaken.1
The links also held after leaving out shift workers, and after allowing for earlier heart attack, stroke, angina, diabetes, high blood pressure, a high body mass index and a high cholesterol ratio.1
The study still only watched people. The authors say habits or health nobody measured may explain part of it.1
Bright here is a rank. The brightest tenth was the brightest tenth of this group, not a lux figure you can hold against your own bedroom.1
Which illnesses go with bright nights?
Mainly heart, circulation and metabolic causes: night light had its largest gaps for those deaths.
Cardiometabolic deaths are deaths from heart and circulatory disease, such as heart attack and stroke, and from endocrine and metabolic disease, such as diabetes. Of the deaths in the study, 798 were of this kind.1
The night link was larger for these deaths than for others. In the most adjusted model, the brightest tenth of nights went with about 33% higher risk of a cardiometabolic death and about 17% higher risk of any other death.1
Fewer deaths per cause means less certainty. For cardiometabolic deaths, the range around that 33% ran from about 6% to about 68% higher.1
A separate analysis of most of the same volunteers looked at new type 2 diabetes. Among 84,790 people, 1,997 developed it over about eight years. Risk was about 53% higher in the brightest tenth of nights. It, too, is a link.2
None of this predicts your own health. Group results say how risk differs between large groups, not what a bright night does to one person.1
Does the time of day matter?
Yes. Bright light in the small hours went with higher risk, and bright light through the daytime with lower risk.
The team also asked it clock time by clock time. For each half hour, they compared the brightest tenth of people with the darker half. Bright light from 1 am to 6 am went with roughly 10 to 40% higher risk of dying. From 8:30 am to 6 pm it went with roughly 10 to 40% lower risk.1
For heart and metabolic deaths the peak came between 2:30 and 3 am. There, the brightest tenth went with 56 to 67% higher risk.1
The authors read this through the body clock, which Your body clock explains. The team fed each person's light record into a model of the human clock to estimate its amplitude, how strongly it swings between day and night. Light near the middle of the biological night is expected to shrink that swing.1
People whose modelled swing was weaker had higher risk, about 4 to 10% higher for each step down of one standard spread. A modelled clock more than an hour early or late also went with higher risk.1
Nobody's own clock was measured. The model is fed with light, so it says what light would be expected to do to a typical clock, not what it did to your own. It was built from studies of healthy younger adults.1
Do bright days help with sleep and mood?
In one UK survey, each extra self-reported hour outdoors by day went with fewer insomnia symptoms and lower odds of depression.
Another UK Biobank team asked volunteers how long they spent outdoors in daylight. The typical answer was 2.5 daylight hours a day. For each extra hour, the odds of lifetime major depression were about 2 to 8% lower, and the odds of insomnia symptoms about 3 to 6% lower.3
Each extra hour also went with finding it easier to get up, feeling tired less often and leaning toward being a morning person. Followed over time, the links held up but were generally smaller.3
Hours outdoors were self-reported, mostly at one point in time, not measured by a sensor. The authors call for studies of how bright the light was at the eye.3
The study counted time, not brightness. If you track your outdoor hours, a cloudy hour and a sunny one counted the same.3
Who took part, and does it apply to you?
Older, healthier-than-average volunteers, almost all white, so the findings may not carry over to everyone.
Biobank volunteers were healthier than the general population, and only 5.5% of those invited took part.4
In the light study, 97% were white, so it is unclear whether the findings carry over to other groups. Only one week of light was recorded, though patterns were stable across repeat weeks in about 3,000 people. The sensor sat on the wrist, not at the eye.1
If you are younger, live elsewhere or are unwell, this group differs from you.1,4
What does this mean for you?
Bright days and dark nights are the pattern the evidence leans toward, though it shows links, not proof.
- Days. An expert panel, not a trial, recommends a minimum of 250 on a melanopic scale at the eye through the daytime, using daylight where it is available. That scale counts how strongly light reaches the eye cells that tell the body clock about light. It is not the same as room lux.5
- Nights. The same panel says the sleeping room should be as dark as possible, at most 1 on that scale.5
- Night shifts. The panel says its recommendations are not meant for night-shift work.5
- Not shown. None of these studies changed anyone's light and watched what followed. They show who was brighter or darker, and who did better.1,3
Sources
Every number in this article comes from these studies. Checked 12 November 2026.
- Windred DP, Burns AC, Lane JM, et al. (2024). Brighter nights and darker days predict higher mortality risk: a prospective analysis of personal light exposure in >88,000 individuals. Proceedings of the National Academy of Sciences. doi:10.1073/pnas.2405924121 · PubMed
- Windred DP, Burns AC, Rutter MK, et al. (2024). Personal light exposure patterns and incidence of type 2 diabetes: analysis of 13 million hours of light sensor data and 670,000 person-years of prospective observation. The Lancet Regional Health Europe. doi:10.1016/j.lanepe.2024.100943 · PubMed
- Burns AC, Saxena R, Vetter C, et al. (2021). Time spent in outdoor light is associated with mood, sleep, and circadian rhythm-related outcomes: a cross-sectional and longitudinal study in over 400,000 UK Biobank participants. Journal of Affective Disorders. doi:10.1016/j.jad.2021.08.056 · PubMed
- Fry A, Littlejohns TJ, Sudlow C, et al. (2017). Comparison of sociodemographic and health-related characteristics of UK Biobank participants with those of the general population. American Journal of Epidemiology. doi:10.1093/aje/kwx246 · PubMed
- Brown TM, Brainard GC, Cajochen C, et al. (2022). Recommendations for daytime, evening, and nighttime indoor light exposure to best support physiology, sleep, and wakefulness in healthy adults. PLoS Biology. doi:10.1371/journal.pbio.3001571 · PubMed