
Training load
In a classic model, each session leaves a fast-fading tiredness and a slow-fading fitness, so you can feel worse while still getting fitter. A single far longer run is linked with more injuries, but no safe ratio of this week against recent weeks has been proven.
What is training load?
The cost of your training to your body. It has an outside part, the work, and an inside part, how your body answers it.
Coaches split a session's load into two parts. The external load is the work itself: kilometres run, minutes ridden, kilos lifted. The internal load is your body's response to that work.1
The same 10 kilometres can be an easy run for one person and a hard one for another. The outside is identical. Only the inside shows the difference.1
The simplest way to measure the inside is to ask. In 2001 a team tested multiplying how hard a session felt, on a rating scale, by its minutes. They tried it on steady cycling, interval cycling and basketball. It tracked a heart-rate-based score consistently, though its absolute numbers ran higher. It was checked against heart rate, not against injuries or fitness.2
Why can you feel worse while getting fitter?
Each session adds fatigue and fitness. In a 1976 swimmer's model, fatigue faded about three times faster, so the two can part ways.
In 1976 four researchers studied one swimmer's 100 metre times. They could model his performance rather well from his training alone, using two quantities that build with training. Both fade, at different speeds. Fitness had a time constant of 50 days, fatigue one of 15, so fatigue faded about three times faster. A time constant is a measure of how slowly an effect fades.3
Picture two buckets with holes in the bottom. Each session pours into both. The bucket with the small hole is fitness, and it holds its water for a long while. The bucket with the big hole is fatigue, and it runs dry much sooner. How you perform follows the gap between the two.3
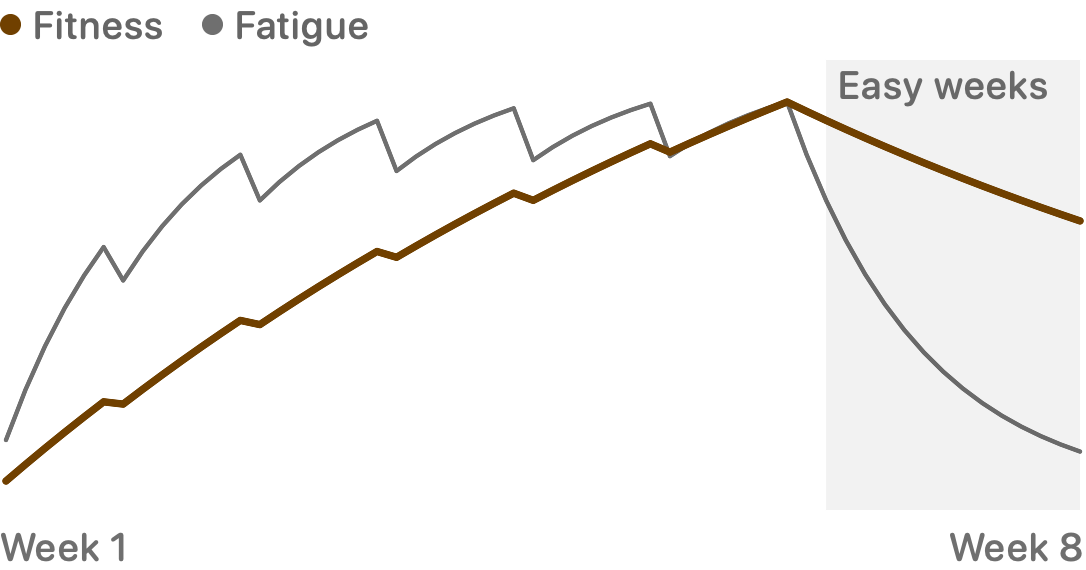
In the model, fatigue builds quickly in a hard week while fitness builds slowly, so you can feel flat while getting fitter. Easing off drains fatigue first, and most of the fitness is still there.3
Real bodies are messier. In nine elite swimmers followed for a season, the same kind of model fitted reasonably well. But the fade times it needed came with wide margins of error: about 38 days for fitness and 19 for fatigue. Some of its numbers were so tangled together that the authors called interpreting them worthless. The two buckets are a way to think about a season, not a forecast.4
How fast does fitness fade, and what keeps it?
Slowly, then it levels off. In early studies you could shorten sessions and keep fitness, but not make them easier.
In 1984 seven endurance-trained people stopped training completely. Their VO2 max, a measure of aerobic fitness, fell 7% in the first three weeks. It levelled off after eight weeks, 16% below its trained value. After 12 weeks it was still above that of eight people who had never trained, 50.8 against 43.3 ml/kg/min.5
The slow fade has a surprising side. In 1981 and 1982, small studies had people train for 10 weeks and then cut back for 15. Going from six days a week to four, or even two, kept their VO2 max. So did shortening each session by up to two-thirds, though staying power over two hours or more fell by 10% with the biggest cut.6,7
A third study cut how hard the sessions were instead, by a third or by two-thirds. VO2 max fell, and fell further with the bigger cut. The authors concluded that intensity is essential for keeping aerobic fitness. Each study had only 12 or 13 people, so hold the results loosely.8
Can a sudden jump in training hurt you?
Possibly: one run far longer than recent ones went with more injuries, but a plan built on the 10% rule did not cut them.
One sports scientist argues that excessive, rapid rises in load, more than training itself, are likely behind many soft-tissue injuries. The same author also argues that people used to heavy training get hurt less than those used to light training. That is a model, not a trial.9
The best-known rule says to raise weekly running by no more than 10%. In a trial, 532 novice runners were split by chance between two plans. One was a gradual 13-week plan built on that rule, the other a standard 8-week plan. About one in five was injured in either: 20.8% and 20.3%. The plans also differed in length, so this tests a graded plan, not the rule on its own.10
A second study followed 874 novice runners. Overall it found no clear difference in injuries between small and big weekly jumps. For one group of injuries, jumps over 30% were linked with more, but the numbers were too small to be sure of.11
A far larger study asked a different question: how long is one run compared with your longest run of the past month? About 5,200 adult runners wore Garmin watches for 18 months and reported their own injuries. A little over one in three had one.12
A run more than 10% longer than anything in the past month went with an injury rate about one and a half times higher. A run more than twice as long went with about 2.3 times. This is a ratio of rates, not extra injuries in every run. The jump in total distance from one week to the next showed no link. The study only watched, so other differences between runners may share the credit.12
Is there a safe ratio of this week to recent weeks?
Not one that has been proven. A famous ratio has a named sweet spot, but critics find no evidence for planning training with it.
Many sports teams compare your last week of load, the acute load, with the weeks before it, the chronic load. The result is the acute:chronic ratio. A 2016 paper called a ratio of 0.8 to 1.3 the sweet spot and 1.5 or more the danger zone.9
In 2020, critics argued that no study had properly tried to show the ratio changes injury rates. They concluded there is no evidence for using it to plan training or cut injury risk. A systematic review of 22 studies found a link with non-contact injuries and called the ratio one tool in a wider monitoring system.13,14
A 2026 pooled analysis of 16 team-sport studies found a small-to-moderate link. Its size varied hugely between studies, and for time-loss injuries it was too weak to be sure of. In the 5,200-runner study the same ratio, this week against the three before, showed the opposite: higher ratios went with a lower injury rate. So no safe threshold has been proved.12,15
What can training load not see?
It counts training only. No single marker reliably shows fatigue, and athletes' own reports followed load better than measured values did.
Training load adds up your sessions. A bad night, an illness or a hard week at work does not appear in it.
A 2014 review found that very few markers of fatigue have strong evidence behind them, and none is definitive. One idea is that a gap between outside and inside load may itself give fatigue away, the same work costing more.16
A review of 56 studies found that measured values and athletes' own reports mostly did not agree. The self-reports followed both acute and chronic training load more sensitively and consistently.17
So the cheapest signals may be your own: your mood and how stressed you feel. In that review, well-being was typically worse after an acute rise in training load.17
What can you do with this?
Fatigue can mask fitness, single long runs are worth watching, and any ratio is only a hint.
- Fatigue before fitness. In the model, a hard block can leave you flat while fitness is still building.3
- One long run. The largest study measured each run against the longest of the past month.12
- Shorter, not easier. In the early studies, shorter or fewer sessions held aerobic fitness. Easier ones did not.6,7,8
- Ratios as hints. No safe ratio has been proven, so read one beside how you feel.13,15
- Pain that will not settle, illness, or a heart condition? Ask your doctor before raising your load.
Sources
Every number in this article comes from these studies. Checked 12 November 2026.
- Impellizzeri FM, Marcora SM, Coutts AJ (2019). Internal and external training load: 15 years on. International Journal of Sports Physiology and Performance. doi:10.1123/ijspp.2018-0935 · PubMed
- Foster C, Florhaug JA, Franklin J, et al. (2001). A new approach to monitoring exercise training. Journal of Strength and Conditioning Research. doi:10.1519/1533-4287(2001)015<0109:anatme>2.0.co;2 · PubMed
- Calvert TW, Banister EW, Savage MV, Bach T (1976). A systems model of the effects of training on physical performance. IEEE Transactions on Systems, Man, and Cybernetics. doi:10.1109/tsmc.1976.5409179
- Hellard P, Avalos M, Lacoste L, Barale F, Chatard JC, Millet GP (2006). Assessing the limitations of the Banister model in monitoring training. Journal of Sports Sciences. doi:10.1080/02640410500244697 · PubMed
- Coyle EF, Martin WH, Sinacore DR, Joyner MJ, Hagberg JM, Holloszy JO (1984). Time course of loss of adaptations after stopping prolonged intense endurance training. Journal of Applied Physiology. doi:10.1152/jappl.1984.57.6.1857 · PubMed
- Hickson RC, Rosenkoetter MA (1981). Reduced training frequencies and maintenance of increased aerobic power. Medicine and Science in Sports and Exercise. doi:10.1249/00005768-198101000-00011 · PubMed
- Hickson RC, Kanakis C, Davis JR, Moore AM, Rich S (1982). Reduced training duration effects on aerobic power, endurance, and cardiac growth. Journal of Applied Physiology. doi:10.1152/jappl.1982.53.1.225 · PubMed
- Hickson RC, Foster C, Pollock ML, Galassi TM, Rich S (1985). Reduced training intensities and loss of aerobic power, endurance, and cardiac growth. Journal of Applied Physiology. doi:10.1152/jappl.1985.58.2.492 · PubMed
- Gabbett TJ (2016). The training-injury prevention paradox: should athletes be training smarter and harder? British Journal of Sports Medicine. doi:10.1136/bjsports-2015-095788 · PubMed
- Buist I, Bredeweg SW, van Mechelen W, Lemmink KA, Pepping GJ, Diercks RL (2008). No effect of a graded training program on the number of running-related injuries in novice runners: a randomized controlled trial. American Journal of Sports Medicine. doi:10.1177/0363546507307505 · PubMed
- Nielsen RØ, Parner ET, Nohr EA, Sørensen H, Lind M, Rasmussen S (2014). Excessive progression in weekly running distance and risk of running-related injuries: an association which varies according to type of injury. Journal of Orthopaedic and Sports Physical Therapy. doi:10.2519/jospt.2014.5164 · PubMed
- Schuster Brandt Frandsen J, Hulme A, Parner ET, et al. (2025). How much running is too much? Identifying high-risk running sessions in a 5200-person cohort study. British Journal of Sports Medicine. doi:10.1136/bjsports-2024-109380 · PubMed
- Impellizzeri FM, Tenan MS, Kempton T, Novak A, Coutts AJ (2020). Acute:chronic workload ratio: conceptual issues and fundamental pitfalls. International Journal of Sports Physiology and Performance. doi:10.1123/ijspp.2019-0864 · PubMed
- Griffin A, Kenny IC, Comyns TM, Lyons M (2020). The association between the acute:chronic workload ratio and injury and its application in team sports: a systematic review. Sports Medicine. doi:10.1007/s40279-019-01218-2 · PubMed
- Ding L, Weldon A, Xu J, et al. (2026). Acute:chronic workload ratio and load management for team sports: a multilevel meta-analysis. Frontiers in Public Health. doi:10.3389/fpubh.2026.1896651 · PubMed
- Halson SL (2014). Monitoring training load to understand fatigue in athletes. Sports Medicine. doi:10.1007/s40279-014-0253-z · PubMed
- Saw AE, Main LC, Gastin PB (2016). Monitoring the athlete training response: subjective self-reported measures trump commonly used objective measures: a systematic review. British Journal of Sports Medicine. doi:10.1136/bjsports-2015-094758 · PubMed