
Heart drift
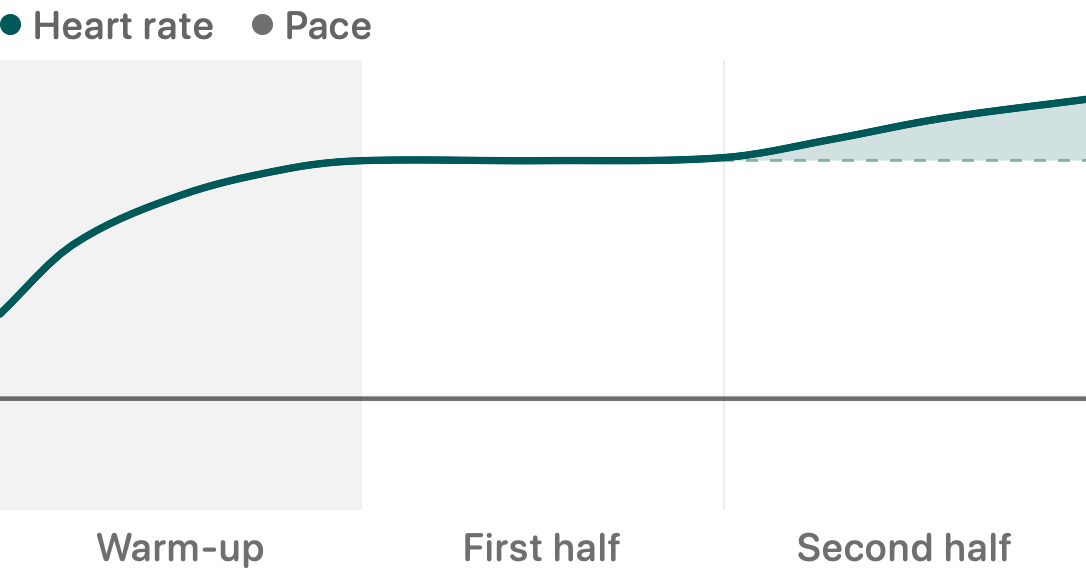
Heart drift compares the first and second halves of an outdoor run. It shows how much your speed per heartbeat rose or fell between them.
What does Heart drift show?
How your speed per heartbeat changed across an outdoor run. A positive figure means your heart rate rose against your pace.
On an outdoor run's page, Heart drift sits in the How steady chapter. Beside it is Pacing, which compares the two halves by hill-adjusted pace alone and prints how far apart they were, without saying which was faster. Under them is Distance per heartbeat, the metres you cover for each beat. Heart drift is one figure, in percent.
Researchers call a slow change in the heart during long exercise cardiovascular drift. One review describes it as a progressive decline in stroke volume, the blood pumped per beat, after 10 to 20 minutes of exercise. Heart drift is Aera's own way of reading a related change from one run.1
A large study followed the idea through a marathon. In 82,303 runners, heart rate rose against speed from the early part of the race to the late part, on average. Runners whose heart rate drifted least finished faster than those who drifted most.2
That is a link between two things measured in the same race, not proof that drift slows you. One review argues that measures taken on a fresh athlete shift during long exercise, and gives the name durability to how soon they start to decline and by how much.3
What goes into it?
Your route and the heart rate readings taken during the run. The workout's average heart rate is never used in their place.
From the route, Aera takes distance, ground height and time, with pauses left out. A run with no route shows no Heart drift, and a treadmill run is one of those.
From your heart rate, Aera takes only readings recorded inside the run and outside its pauses, between 30 and 240 beats a minute. It never swaps in the workout's average. A run that has only an average shows nothing.
How is it worked out?
Aera sets aside the warm-up, splits the rest into equal halves by distance, and compares speed per heartbeat in each.
Heart rate is still climbing in the first minutes of a run, so a first part that held the warm-up would look too easy. Aera sets aside up to the first 10 active minutes.
It never sets aside so much that less than 20 minutes remain. A 25-minute run therefore loses 5.
The 10 minutes is Aera's own choice, not a number any study gives for a warm-up. It sits at the start of the 10 to 20 minutes after which cardiovascular drift is described.1
The rest is cut into two halves of equal distance. For each half, Aera divides your speed by the average of the heart rate readings inside it.
Heart drift is how much lower the second half's figure is than the first half's, in percent. A positive number means your heart rate rose against your pace. A negative number means it fell, and the page prints it with a minus sign.
Speed is adjusted for hills first, so a climb late in the run does not read as fading. Uphill, the adjustment follows a lab study of runners on a tilting treadmill.4
Downhill, Aera does not use that study. Strava's engineers fitted a curve to heart rate data from many runs and described it in an engineering note, not a published study. Aera draws its own curve through three points from that note. These are Aera's choices.
When does it show nothing?
When the route, pace or heart rate is too thin to trust. Aera shows nothing rather than a shaky figure.
Your run needs at least 20 minutes with pauses left out and, after the warm-up, at least 1,000 m of route.
A gap in the route longer than 2 minutes rules the run out, and so does a speed above 12 metres a second.
Each half of the run needs at least 5 heart rate readings that cover at least 70 percent of its time. No gap between readings can be longer than 2 minutes.
Heart drift is for steady runs. Aera cuts the run into 8 equal-distance stretches, and the spread of pace between them can be no more than 15 percent of the average. Hard intervals and stop-and-go runs usually show nothing.
The ground matters too. Aera looks at 32 short slices of the route. None can be steeper than 15 percent, and the highest and lowest slope can be no more than 20 points apart.
On very steep ground the hill correction is least certain, so Aera shows nothing rather than a number it cannot back. All of these cut-offs are Aera's choices, not taken from a study.
How does it compare with your usual?
The page gives no good or bad word. It sets your figure against your usual, drawn from your recent runs.
Your usual is the range that the middle half of your Heart drift figures covered. It is drawn from your earlier runs of the same type in the 30 days before this one that have a figure. It appears once you have 3 of them.
The chapter then answers in one line, and says where you sat, not whether that was good. It reads Within your usual, or Heart drift above your usual, or Heart drift below your usual. When several figures in the chapter are outside theirs, it counts them.
Pacing and Distance per heartbeat get their usual the same way, from your earlier runs of the same type. One figure can sit inside its usual while another sits outside.
What can't it tell you?
Why your heart rate moved, or what it means for your fitness. It is one run's reading, with no good or bad.
Heart drift uses only your route and your heart rate, so it cannot say why the figure moved. It is a field reading from one run, not a test of your fitness.
If a wrist sensor records your heart rate, it can be off more in motion. In a test of optical wearables, error during activity was on average 30% higher than at rest. That test did not include chest straps. Heart drift compares the averages of two stretches of such readings. How a watch measures you says more.5
The research behind it is young. The review that names durability says models that account for these shifts would benefit from development. The marathon study compared an early and a late stretch of a race. Aera compares halves of a shorter run, so that finding may not carry over.2,3
Sources
The studies behind this article. Where a number is Aera's own choice, the text says so. Checked 12 November 2026.
- Coyle EF, González-Alonso J (2001). Cardiovascular drift during prolonged exercise: new perspectives. Exercise and Sport Sciences Reviews. doi:10.1097/00003677-200104000-00009 · PubMed
- Smyth B, Maunder E, Meyler S, Hunter B, Muniz-Pumares D (2022). Decoupling of internal and external workload during a marathon: an analysis of durability in 82,303 recreational runners. Sports Medicine. doi:10.1007/s40279-022-01680-5 · PubMed
- Maunder E, Seiler S, Mildenhall MJ, Kilding AE, Plews DJ (2021). The importance of 'durability' in the physiological profiling of endurance athletes. Sports Medicine. doi:10.1007/s40279-021-01459-0 · PubMed
- Minetti AE, Moia C, Roi GS, Susta D, Ferretti G (2002). Energy cost of walking and running at extreme uphill and downhill slopes. Journal of Applied Physiology. doi:10.1152/japplphysiol.01177.2001 · PubMed
- Bent B, Goldstein BA, Kibbe WA, Dunn JP (2020). Investigating sources of inaccuracy in wearable optical heart rate sensors. NPJ Digital Medicine. doi:10.1038/s41746-020-0226-6 · PubMed