
220 minus your age
Researchers wrote in 2001 that 220 minus your age was never tested on enough older adults, then found it runs low for them. Yet every age formula still misses individuals by a wide margin.
Was 220 minus your age ever tested?
Not on enough older adults, a 2001 team wrote. Their pooled data gave 208 minus 0.7 times age instead.
Your maximum heart rate is the fastest your heart can beat in an all-out effort. Exercise programmes are often built on it. Measuring it takes a test to exhaustion, so a formula based on age is often used instead.1,2
The best-known formula, 220 minus your age, is credited to Fox and colleagues in 1971, in a review of physical activity and heart disease. In 2001 Tanaka's team in Boulder, Colorado, wrote that its validity had never been established in a sample with enough older adults.1,2,3
So they checked. First they pooled the group averages from 351 studies, 18,712 healthy adults in all. Maximum heart rate was strongly tied to age, on the line 208 minus 0.7 times age. Then they tested 514 healthy people in a laboratory study. That line was 209 minus 0.7 times age, virtually identical.1
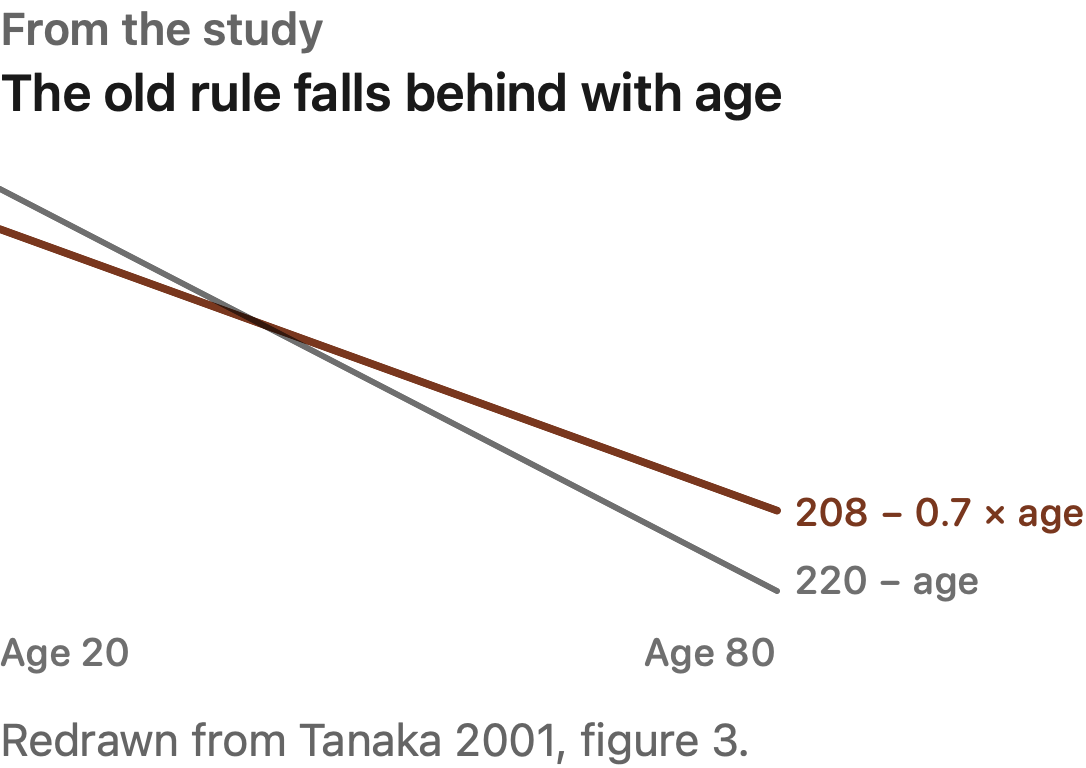
The two lines meet at 40, where both give 180. Younger than that, the old rule gives the higher number. Older, it gives the lower one, and the gap widens. At 70 it gives 150, against 159.1
If you are past 40, a programme built on 220 minus your age starts, on average, from a maximum that Tanaka's data say is too low. The authors warned that this would understate the physical stress of an exercise test and the right intensity for a prescribed programme.1
Do other studies land on the same line?
Close to it: 3,320 Norwegians gave 211 minus 0.64 times age, and 25 years of tests on the same people gave 207 minus 0.7.
A Norwegian team in Trondheim, led by Nes, used the HUNT Fitness Study. It took 3,320 healthy men and women over a wide range of ages. A person counted only if a maximal effort could be confirmed in the test. Their line was 211 minus 0.64 times age. Three earlier formulas underestimated the measured maximum in people older than 30.4
Those lines compare different people at different ages. Another kind of check follows the same people as they age. Gellish and colleagues went through 25 years of exercise tests on 132 people at a university fitness centre. Their line was 207 minus 0.7 times age, almost Tanaka's.5
Three designs, then, land close together. Take a 70-year-old. The old rule gives 150. Tanaka's line gives 159, Gellish's 158 and Nes's 166. Nes's line is the highest, with a flatter slope.1,4,5
If you are past 45, every one of these lines puts your expected maximum above the old rule's number. Where you sit around those lines is another matter, taken up below.1,4,5
Does it differ for women, or for people who train?
Two large studies found no gap by sex or training. A study of women found a steeper fall with age.
Tanaka's team found the same line for men and women. It held across wide differences in habitual activity. The Norwegian team found no sign that sex, physical activity, fitness (measured by peak oxygen use) or body mass index changed the line. Differences between those groups were minor once age was allowed for.1,4
Not every study agrees about women. A Chicago team led by Gulati gave 5,437 women with no symptoms, 52 years old on average, a stress test that ended when symptoms made them stop. Their line was 206 minus 0.88 times age, steeper than the others. They concluded that the traditional male-based formula overestimates the maximum for age in women.6
The Norwegian team's finding pointed the other way: women's maximum was higher than earlier reports had it. The abstracts do not say why the results differ. The tests were not alike: Gulati's women stopped when symptoms made them, while the Norwegian team kept only tests where a maximal effort could be confirmed.4,6
On average, how much you train did not change the line in these studies.1,4
Why does your top heart rate fall with age?
In one small study of men, the heart's own pacemaker slowing, plus a weaker response to adrenaline, accounted for 83% of the gap.
Colorado researchers compared 15 healthy men aged 65 on average with 15 aged 25. The older men reached 162 beats a minute at the end of a treadmill test to exhaustion. The young men reached 191.7
To look into why, they blocked the nerve signals to the heart with a drug. That shows the heart's own pace, called the intrinsic heart rate. It was 58 beats a minute in the older men and 83 in the young. They also measured how much the heart sped up when given a drug that acts like adrenaline.7
Allowing for those two measures cut the age gap in top heart rate by 83%, to a size that could be chance. The pacemaker's own slowing played by far the biggest part.7
This was a small study of 30 healthy men, so it says nothing about women. It also explains a gap between two groups, not where one person's top rate sits.7
For you, that slow loss adds up. On Tanaka's line, 0.7 of a beat a year takes about 28 beats off the ceiling over 40 years, close to the 29 between these two groups.1,7
How close is a formula for one person?
Not very: the typical error is 10.8 beats a minute, and the formulas miss some people by far more.
The Norwegian line comes with a typical miss of 10.8 beats a minute. Its authors say this must be taken into account. A formula gives a group's average, not your own number.4
In 2020 Shookster's team at George Mason University in Virginia ran 99 people through a treadmill test to exhaustion. A test counted only if their breathing showed they had truly reached their limit. They then set nine formulas against the measured maximum. The people were 38 years old on average, and most were aged 26 to 51.2
On the group average, both 220 minus age and Tanaka's line landed close to the measured value. Nes's line was one of four that differed from the measured average, and here it ran about 5 beats high. The authors said 220 minus age may be the best option for a general population. It was less likely to run low for some people and high for others.2
But the range holding most people was wide for all nine. For Tanaka's line it ran about 21 beats either side, and for the old rule about 23. So a 40-year-old guessed at 180 could really top out near 160 or near 200.2
This group was fitter than average, and close to the age where the old and new lines agree anyway, so it cannot settle the question for older adults.2
Only your own test can show whether you sit above or below the line.2
What does this mean for you?
An age formula is a starting guess. A maximum you have measured is better than any formula.
- A starting guess. Past 40, three studies found 220 minus age runs low on average. A group mostly aged 26 to 51 found it did as well as the newer lines. None of these formulas shows where you sit.1,2,4,5
- A test beats a formula. The studies above set the formulas against a maximum measured in an exercise test. Shookster's authors say to use such a test where available.2
- Your own highest. Your watch may have recorded a high heart rate in an all-out effort. None of these studies tested whether that matches a laboratory maximum, so it is still a guess. Heart rate zones tells how Aera picks your maximum.2
- Heart condition or slowing medicine? These studies tested people without heart problems. Ask your doctor how to set your effort.1,2,4
Sources
Every number in this article comes from these studies. Checked 12 November 2026.
- Tanaka H, Monahan KD, Seals DR. (2001). Age-predicted maximal heart rate revisited. Journal of the American College of Cardiology. doi:10.1016/S0735-1097(00)01054-8 · PubMed
- Shookster D, Lindsey B, Cortes N, Martin JR. (2020). Accuracy of Commonly Used Age-Predicted Maximal Heart Rate Equations. International Journal of Exercise Science. doi:10.70252/XFSJ6815 · PubMed
- Fox SM 3rd, Naughton JP, Haskell WL. (1971). Physical activity and the prevention of coronary heart disease. Annals of Clinical Research. PubMed
- Nes BM, Janszky I, Wisløff U, Støylen A, Karlsen T (2013). Age-predicted maximal heart rate in healthy subjects: the HUNT fitness study. Scandinavian Journal of Medicine and Science in Sports. doi:10.1111/j.1600-0838.2012.01445.x · PubMed
- Gellish RL, Goslin BR, Olson RE, et al. (2007). Longitudinal modeling of the relationship between age and maximal heart rate. Medicine & Science in Sports & Exercise. doi:10.1097/mss.0b013e31803349c6 · PubMed
- Gulati M, Shaw LJ, Thisted RA, et al. (2010). Heart Rate Response to Exercise Stress Testing in Asymptomatic Women: The St. James Women Take Heart Project. Circulation. doi:10.1161/CIRCULATIONAHA.110.939249 · PubMed
- Christou DD, Seals DR. (2008). Decreased maximal heart rate with aging is related to reduced beta-adrenergic responsiveness but is largely explained by a reduction in intrinsic heart rate. Journal of Applied Physiology. doi:10.1152/japplphysiol.90401.2008 · PubMed